Welcome to reSolve!
reSolve provides free maths resources for Australian educators—rich tasks and engaging content designed to get students thinking and working like mathematicians, aligned to all state and territory curricula.
reSolve provides free maths resources for Australian educators—rich tasks and engaging content designed to get students thinking and working like mathematicians, aligned to all state and territory curricula.


AUS Year 6 | NSW Stage 3 | WA Year 6 | VIC Level 6

AUS Year 3 | NSW Stage 2 | WA Year 3 | VIC Level 3

AUS Year 4 | NSW Stage 2 | WA Year 4 | VIC Level 3

Our new digital teaching sequences are designed from the ground up to be easily adapted for your students. You can use the step-by-step outlines as-is or adapt them using the built-in design advice, with confidence that your teaching is grounded in the latest research and fully aligned to the Australian Curriculum V9.
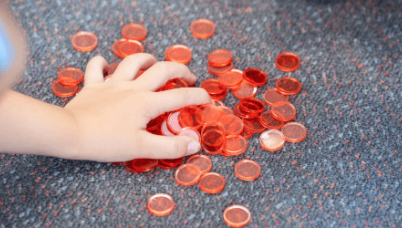
Students learn to use subitisable groups and benchmark numbers to quantify and compare collections up to 20.
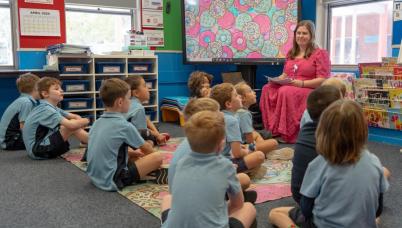
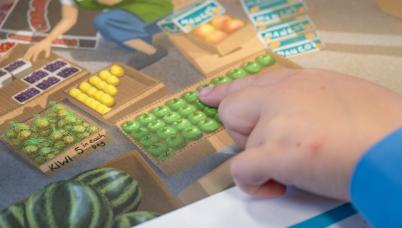
Students use everyday classroom experiences to investigate the story of their class data. They collect and record data about how many are in the class, and make informed predictions.
Students count and connect number names, numerals, and quantities, as they make plans for a class tea party.
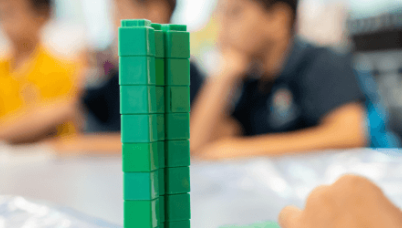
Students learn that 10 ones can be grouped together to form a unit of 1 ten, and they apply this knowledge to two-digit numbers.
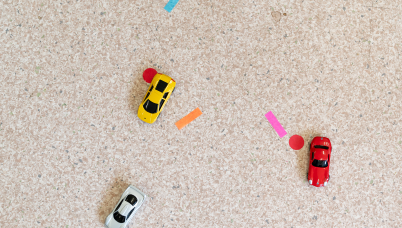
Students make predictions, collect and record data about how a far a toy car might roll. They use the data they collect as evidence to refine subsequent predictions about their car.
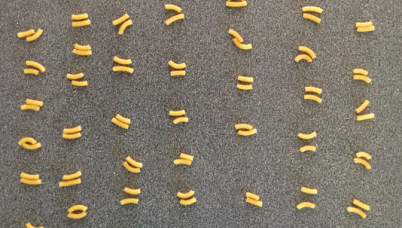
Students take handfuls of macaroni and investigate efficient counting strategies to check whether their handful contains 100 pieces.
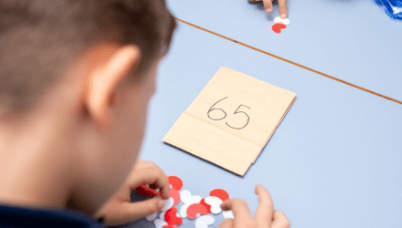
Students learn that “10 of these are 1 of those”, and they apply this knowledge to three-digit numbers.
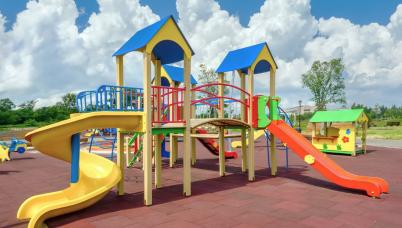
Students investigate the problem of designing a class playground that is fun for everyone. They plan, collect, record and analyse survey data to conclude what playground features students would like.
Students use correct terminology and visual representations, including Venn diagrams, to sort and describe one-digit, two-digit and three-digit numbers looking for similarities, differences and generalisations in our number system.
Students learn that the array is a powerful representation of multiplication: rows and columns represent factors, and these factors can be multiplied to find the product.
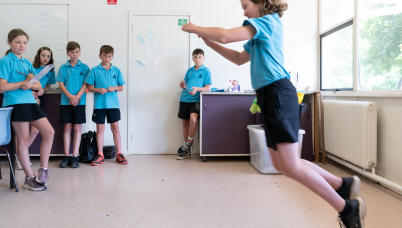
Students investigate how far they can jump. They define their question, plan to collect and record data. They analyse this data and use it as evidence to answer the question.
Students build their understanding of multiplication by exploring the concept of “for each” through Cartesian product. They work out how many different robots can be built using three robot heads, three bodies and three types of legs.
Students learn to use the properties of multiplication to solve multiplication problems which are represented as an array.
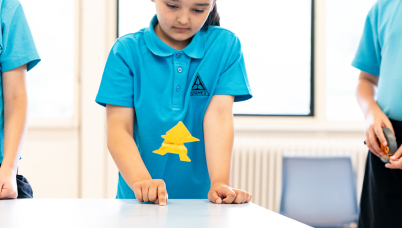
Students investigate how far an origami frog can jump. They define their question, plan, collect and record data. They analyse this data and use it as evidence to answer the question.
Students navigate, design, and analyse number mazes to investigate why some paths always give an odd total and others don’t, building towards a general explanation of how odd and even numbers behave when added.
Students learn how to collect and analyse historical weather data, and use this data to make predictions about the best time to play outside at different times of the year.
Students use an animal flip book to explore the multiplicative idea of “for each” by determining the number of possible animal combinations, represented as a Cartesian product.
Students make loopy aeroplanes using different designs. They collect, represent and analyse data to answer the question "Which loopy aeroplane design is best?”.
Students investigate agricultural show pen designs by building, testing and comparing connected square-pen arrangements. They develop step-by-step and relational rules for growing patterns, including rules with rows and columns, then apply these rules to compare panel use and cost to justify an efficient show design.
Students use mathematical modelling to explore codebreaking.
Students use linear models to investigate how screen time contributes to carbon dioxide emissions. They consider their personal digital footprint and make predictions about future emissions.
Students use data to (re)create two rules of thumb and apply mathematical models to predict the rate of spread of bushfires.
Using the context of Baldwin Street, the world’s steepest residential street, students measure and represent steepness in multiple ways, connect gradient to tangent, and consider how mathematical information is communicated to real audiences.
Students investigate the relationship between wealth and happiness using real-world data, constructing and interpreting scatterplots, lines of best fit, and $r^2$ values. They compare models, make predictions, and consider the limits of correlation in explaining real-world phenomena.